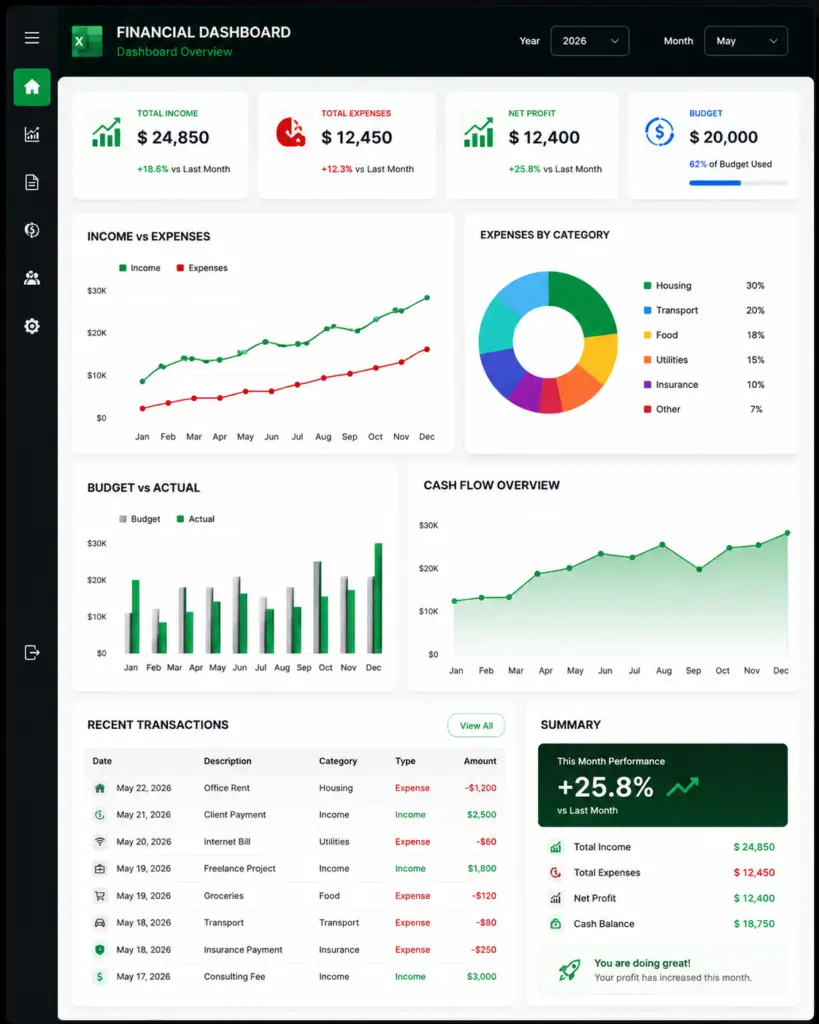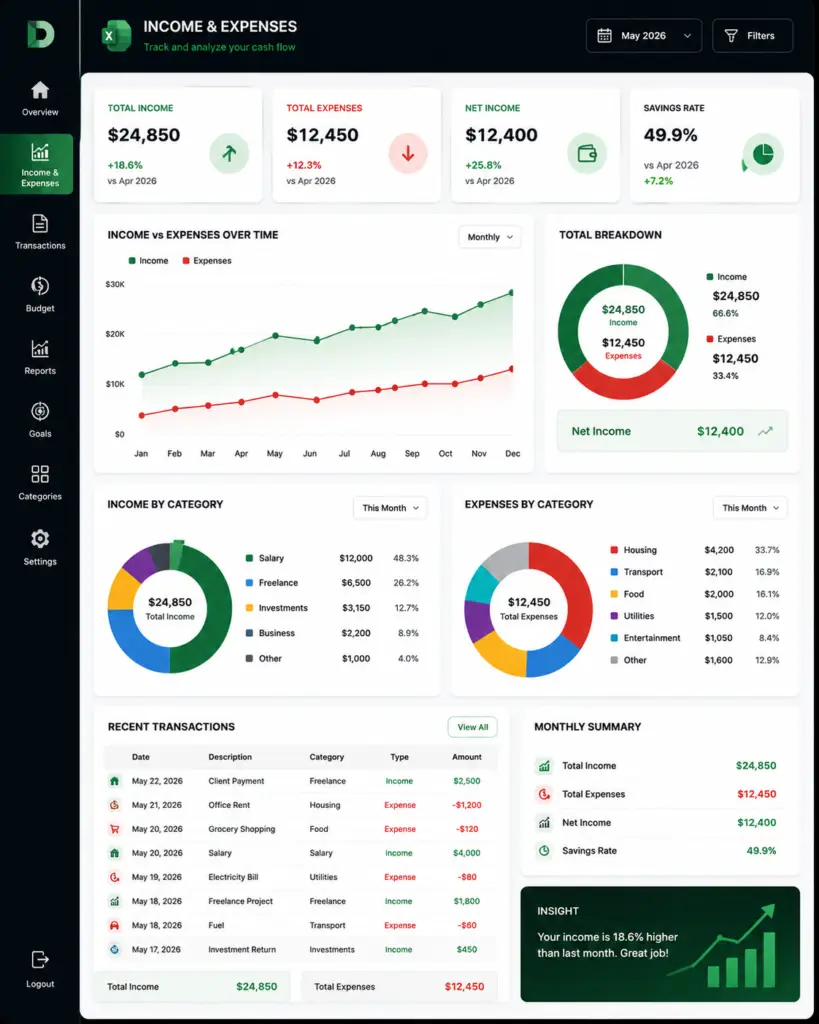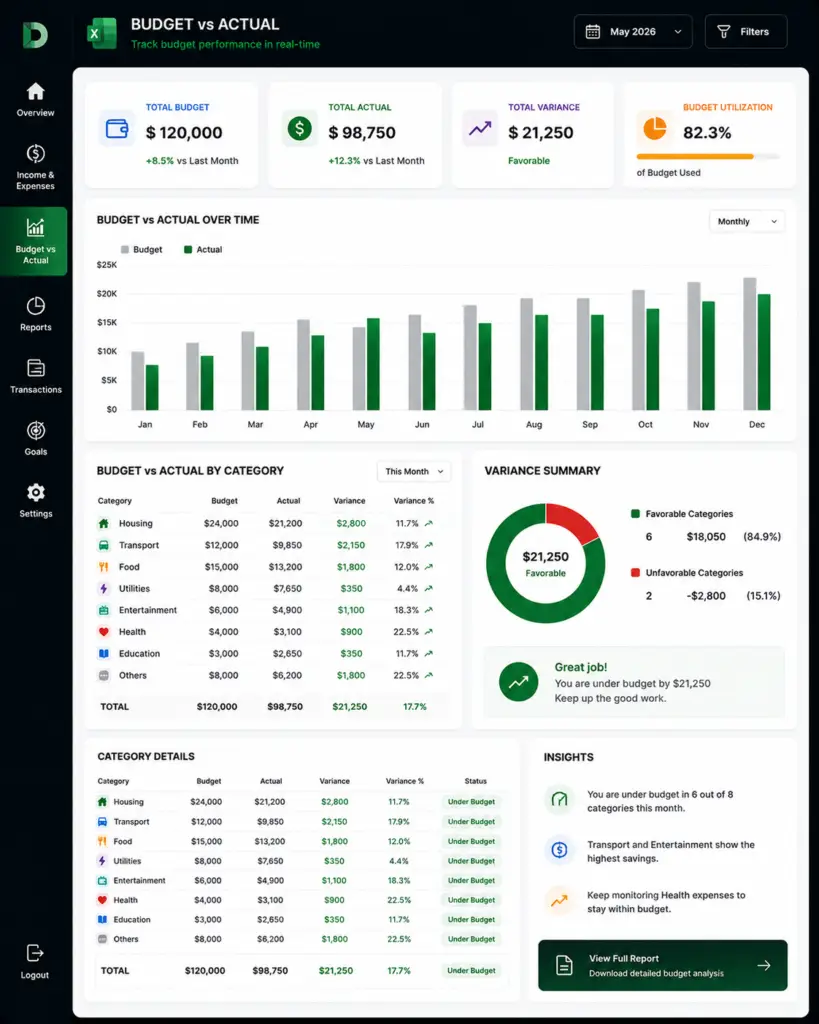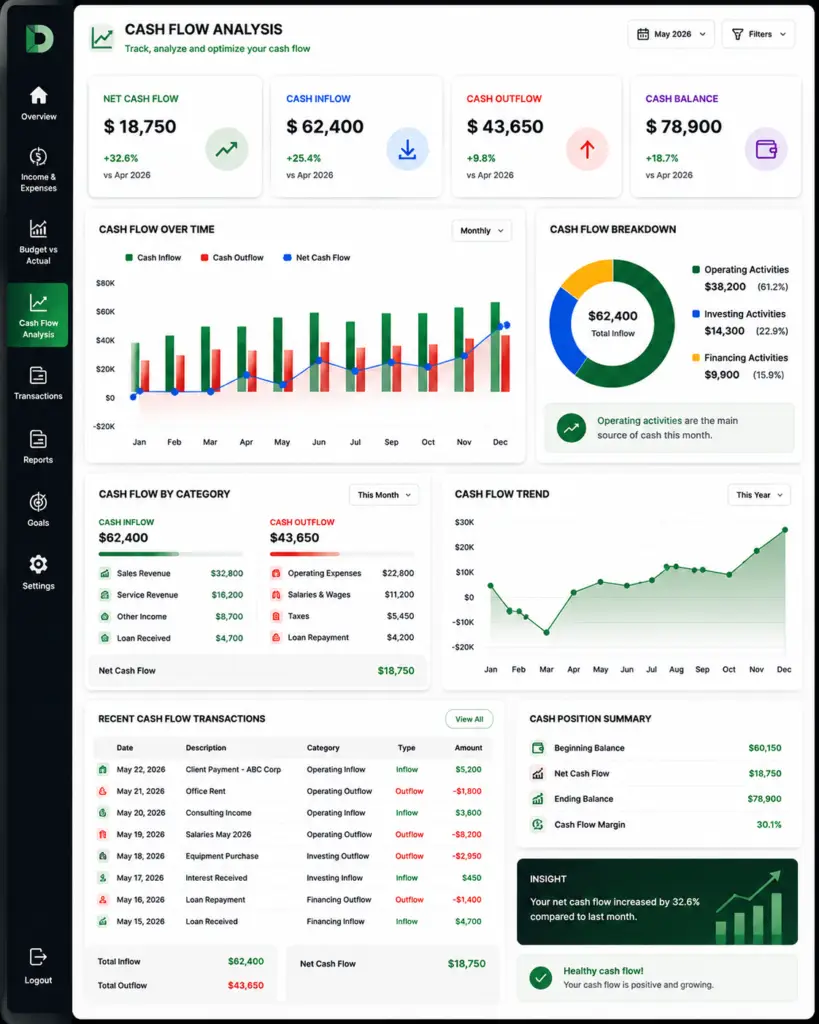
An interactive Excel dashboard that helps businesses track financial performance, compare budgets with actuals, analyze expenses, and generate automated monthly reports.
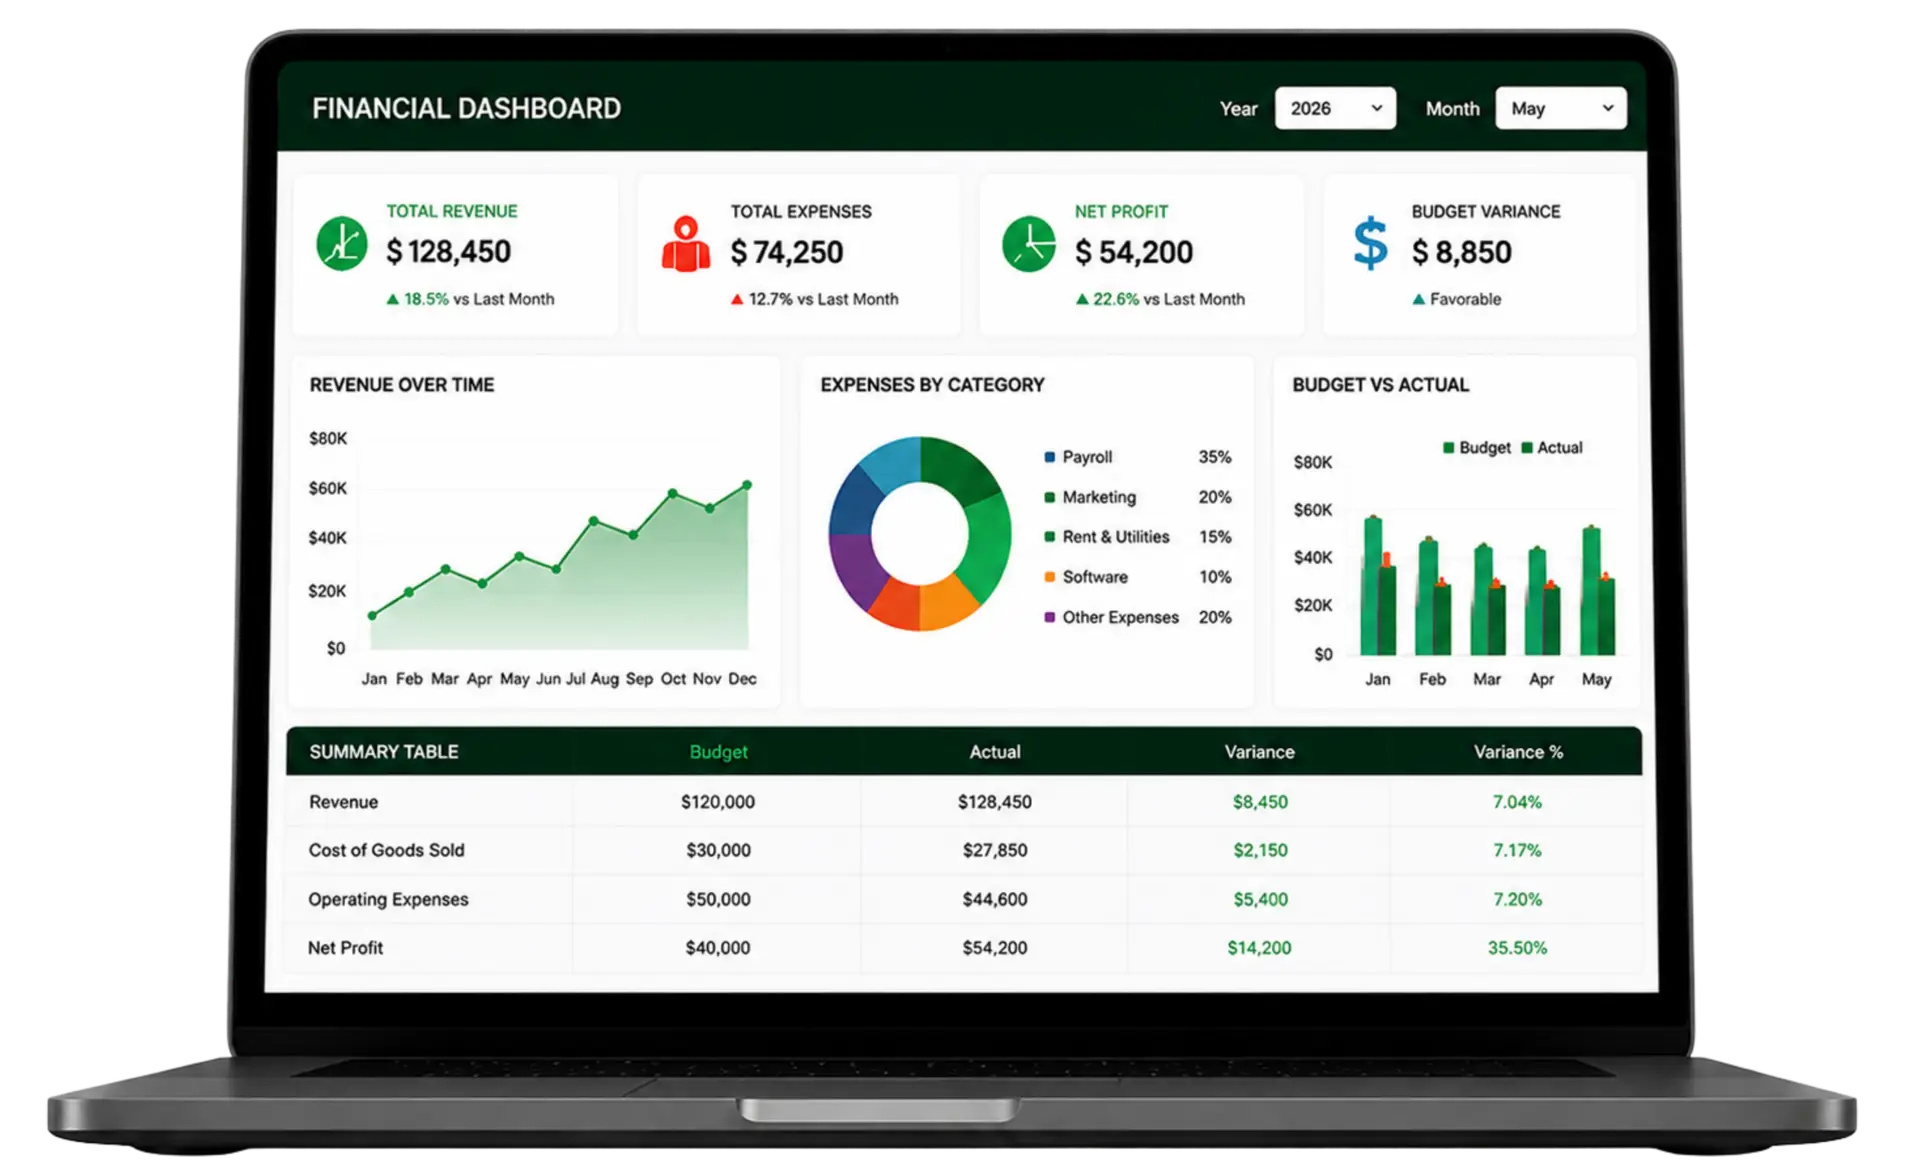
This Financial Dashboard & Budget Tracker transforms raw transaction data into a clear and interactive financial reporting system.
The dashboard provides an instant overview of revenue, expenses, net profit, budget performance and cash flow. Users can filter the report by year and month, review expense categories and compare actual results against planned budgets.
The entire solution is designed in Excel, making it easy to update, customize and use without complicated accounting software.
Explore a complete financial management solution designed to help businesses monitor performance, analyze expenses, control budgets, and optimize cash flow. Each dashboard is fully interactive, automated, and built in Microsoft Excel to transform complex financial data into clear, actionable insights.